Case Study - Auto
Our Marketing Mix Optimization & Sales Forecasting Platform answered all of the tough questions posed by our clients:
Q: Measure media elasticity for advertised (primary) and non-advertised (other) vehicle nameplates.
A: Media elasticity was ~60% higher for other nameplates compared to primary nameplates.
Q: Assess media contributions to sales volumes
A: Key sales drivers: Network TV, Lower Digital Funnel, and Consumer Print. Highest marginal ROI: Local Dealer Spot TV, Consumer Print, VOL SEM, Radio, Primary Nameplate Spot TV, Spot Cable.
Q: Optimize marketing mix for maximum sales
A: Our model’s reallocation of the existing budget increased marginal ROI by ~1.5% and showed that $11M in incremental spend would boost ROI by ~6.5%.
Q: Identify media spend needed to achieve a 3% market share increase
A: A 5.3% increase in industry spend share achieved the 3% market share goal, with 44% impact in the current quarter and 56% over the next four quarters.

Case Study - Entertainment
Challenge
Optimize the marketing mix to maximize Return-On-Investment (ROI) and forecast next years response volumes.
Solution
Implementation of Polaris’s Marketing Mix Optimization & Sales Forecasting Platform.
Results
After optimizing the marketing mix, ROI improved by 10.3%
By utilizing six market-level marketing mix models, we developed a forecast for the following year that was within 1.5% of actual results (362,500 vs. 368,100)

Case Study - Healthcare
Challenge
Quantify impact of all media & marketing tactics on urgent care visits for national chain of clinics
Solution
Implementation of Polaris’s Marketing Mix Optimization & Sales Forecasting Platform.
Results
Inputs included radio, print, display, search, direct mail, email, shared mail, out-of-home, promotions and several other tactics.
All media / tactics are statistically significant and generate in excess of 15% of total patient visits.
Year-Over-Year optimization increased annual media stimulated patient visits 5X over a 4-year period.
From Year 1 to year 4, Return-on-Investment (ROI) increased by 276%.
Efficiency improvements continued into the 4th year despite a lower overall budget.
The platform was also used by revenue management to generate 3-year forecast outlook of total patient visits and revenue. Based on weekly data, forecasts made 52 weeks in advance for the next fiscal year (12 months out) were 7% low vs. actual.
Case Study - Retail
Challenge
Optimize our client’s multi-channel mix to maximize store traffic, net sales / revenue, average order value, and Media Return-On-Investment (ROI)
Quantify & control for macroeconomic and customer experience impacts
Solution
Implementation of Polaris’s Marketing Mix Optimization & Sales Forecasting Platform.
Results
Through the course of the first 24 months of the platform, continuous marketing performance improvement, powered by Marketing Mix Manager®, generated:
+19% lift if Store Traffic
+26% increase in Upsell / Net Sales
+30% improvement in All-Media ROI
Primary macroeconomic & customer experience impacts included
A 1% increase in gas prices generates 5.5% downward pressure on store traffic
A 1% improvement in consumer confidence increase store traffic buy 6.8%
A 1% increase in Avg. Customer 5-Star Rating boost store traffic by 1.4%
A 1% increase in customers who are Likely-to-Recommend increases store traffic by 0.7%

Case Study - Telecommunications
Challenge
Quantify the impact of stronger customer experience scores across 57 lines-of-business (LOB’s) on total company revenue.
Solution
Developed survey-based Customer Loyalty Index (CLI)
Combined CLI’s by LOB
Developed a time-series based model linking service quality metrics to CLI’s and CLI’s to total revenue
Supported service optimization with quality-control reporting
Forecasted total revenue to track actual revenue gains toward revenue targets
Results
Improvements in service quality produced a annual lift of $525MM (+3.5%) lift in total revenue.
The overall ROI, including the costs to improve service quality, was 21%
Quarterly forecasts averaged 3.1% mean absolute percent error (MAPE)

Case Study - Travel & Leisure
Challenge
Quantify impact of media & marketing tactics on website traffic and optimize the mix to maximize the traffic.
Solution
Marketing Mix Optimization Platform for Website Traffic
Results
Eleven media / tactics were linked to website traffic
The eleven media / tactics generated about 70% of total website traffic
Through optimization of a flat budget, website traffic increased 23% in the first year and another 15% in the second year
Year-over-year increase were seen in all Key Performance Metrics (KMP’s) including click throughs, time on sight, and conversions
All media ROI increased from less than $9.50 / $1.00 in Year 1 to more than $14.00 / $1.00 in Year 3.
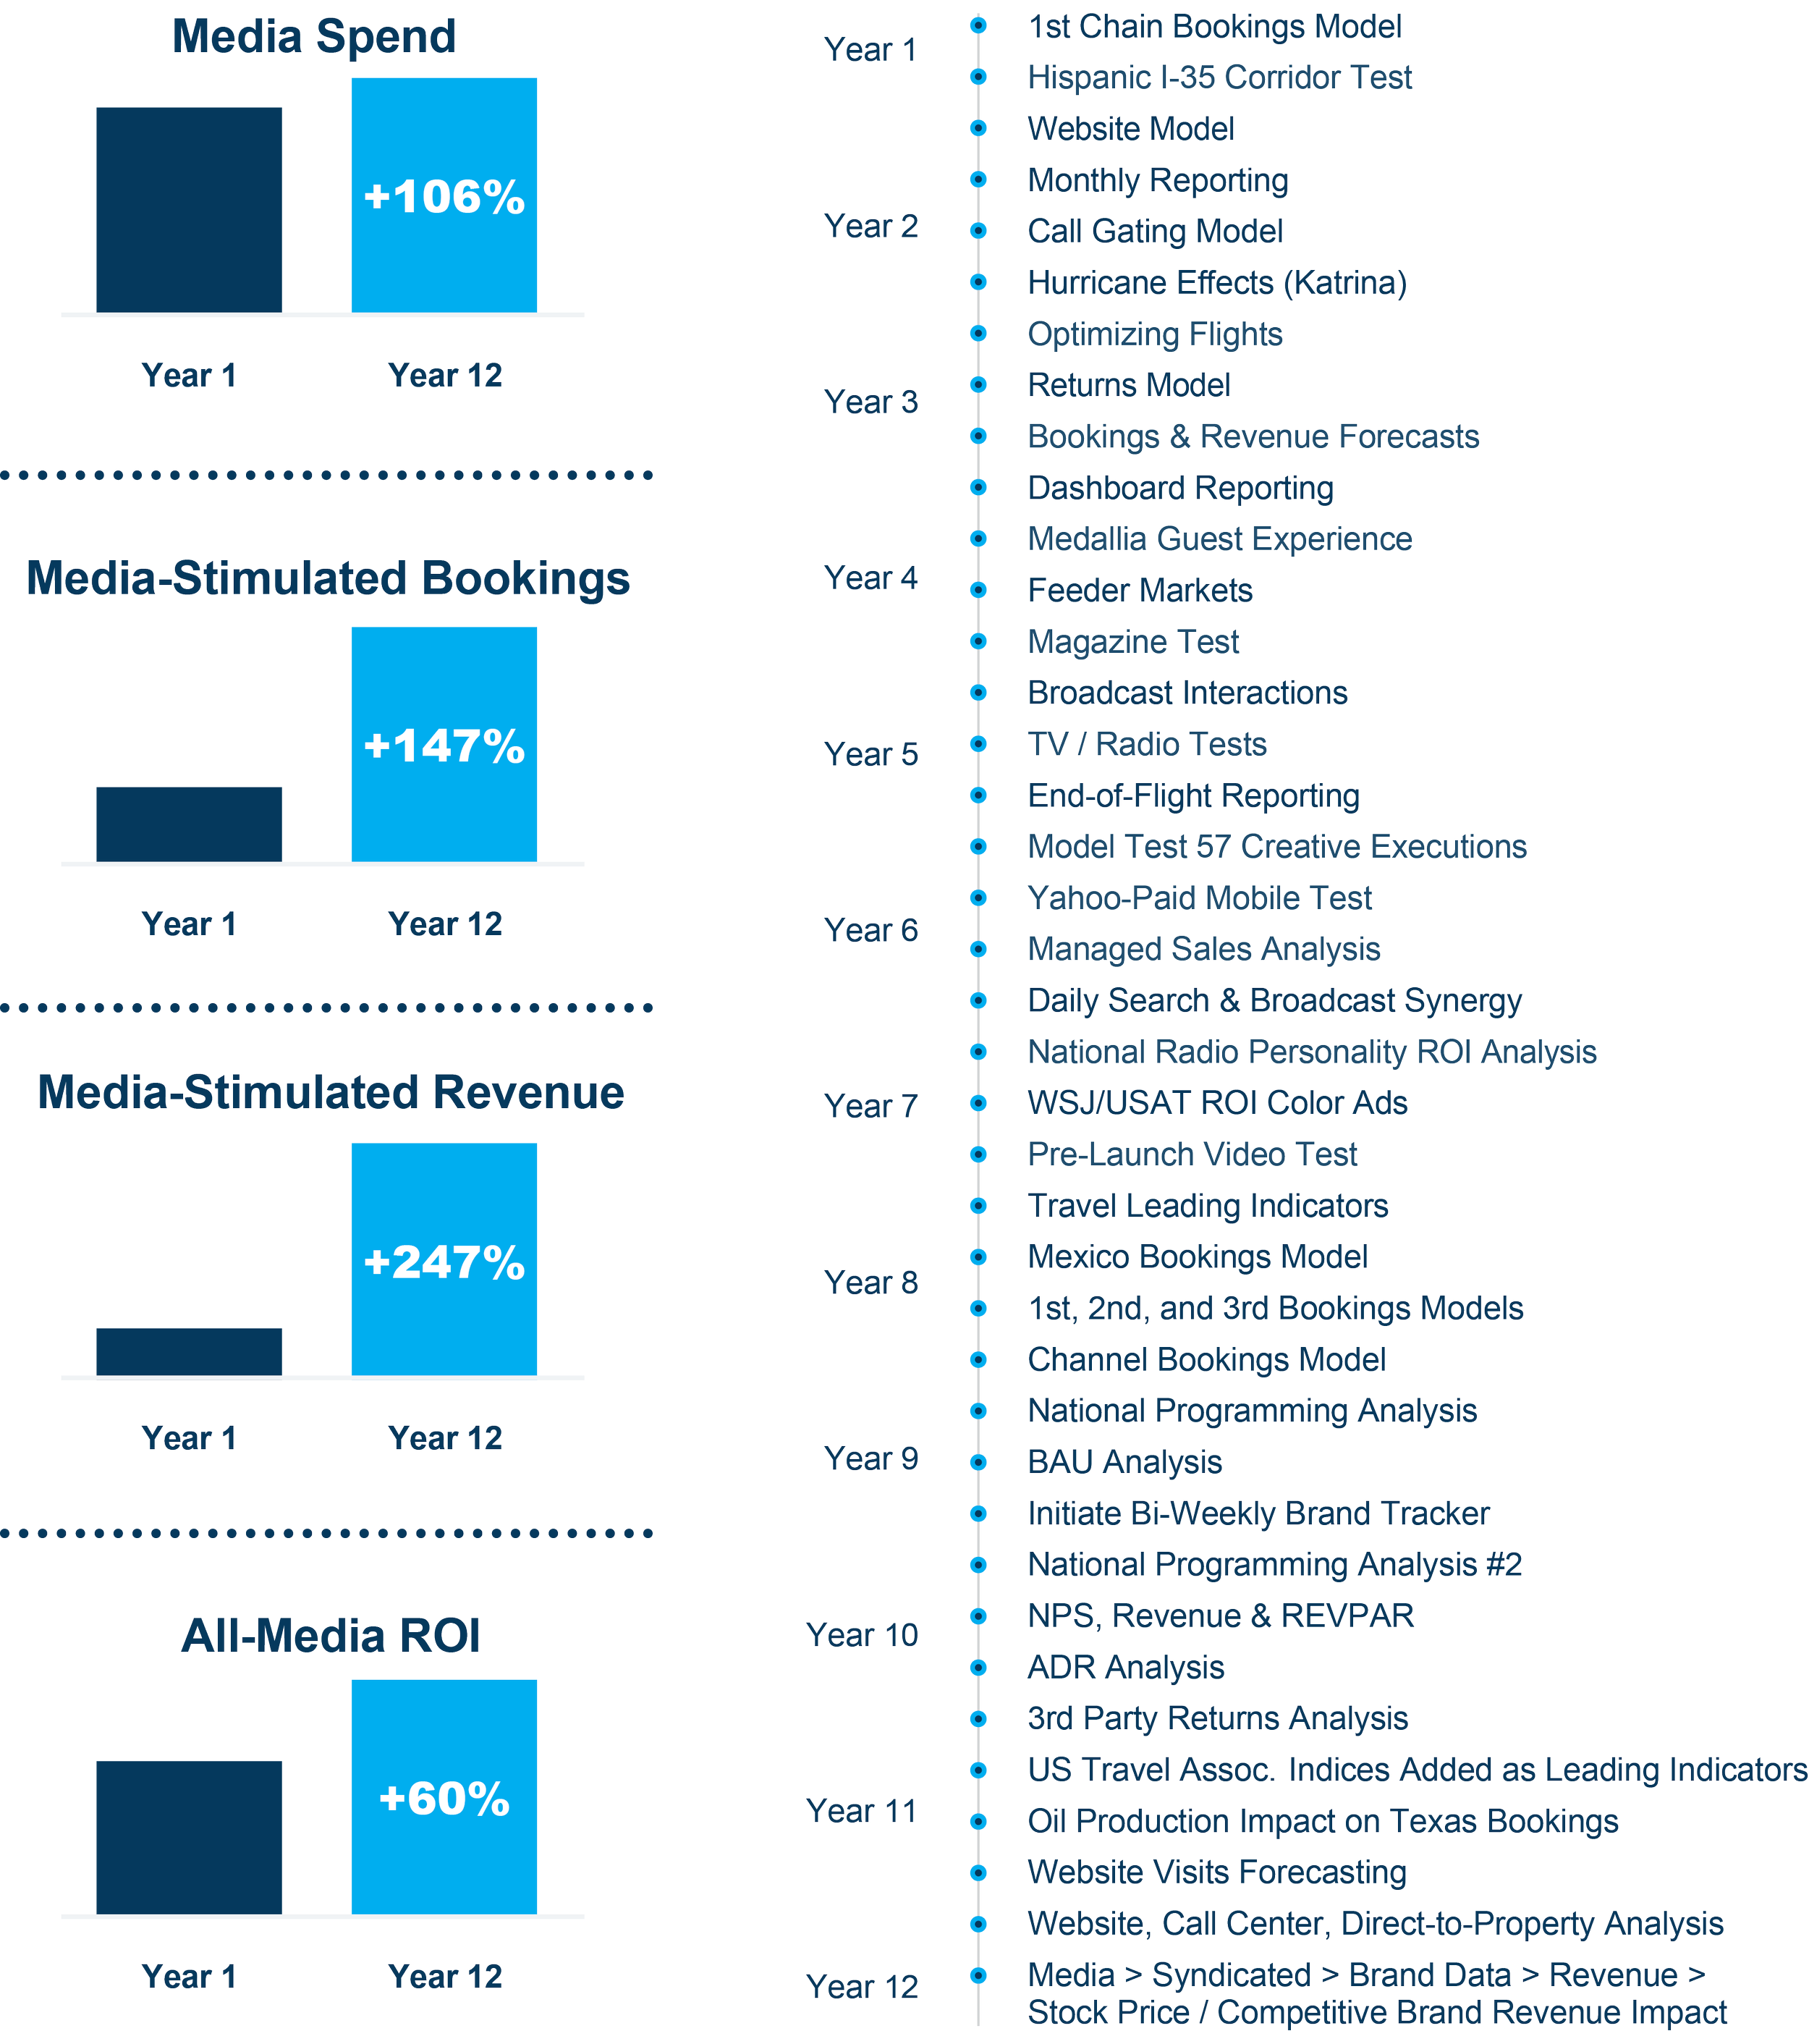
The Evolution of the Platform