

Upgrade Your Marketing Mix Modeling with Omnichannel Capability
Unlock Next-Level Insights through Advanced Attribution & Optimization.
We Measure: All Media Channels | Creative | Pricing | Promotions | Brand | Customer Experience | Economic Indicators.

Elevate Your Marketing Strategy With Omnichannel Attribution & Optimization
Discover how our custom solution takes marketing mix modeling to the next level and turns your business data into actionable intelligence, optimizing every dollar spent across channels for unbeatable results.
Unlock True Business Growth: Why Omnichannel Attribution & Optimization Surpasses Traditional Marketing Mix Modeling
Traditional marketing mix modeling (MMM) often falls short, relying on outdated, broad-channel data that misses the real-time drivers of consumer behavior. At Polaris Research, our Omnichannel Attribution & Optimization delivers a transformative, data-driven approach that goes beyond MMM’s limitations. By quantifying the impact of every touchpoint, we empower you to make smarter decisions, maximize ROI, and accelerate growth. From social media to macroeconomic trends, our solution uncovers hidden opportunities, optimizes budgets with precision, and turns marketing into a powerful growth engine.
Here’s why Omnichannel Attribution & Optimization is a game-changer for your business:
Comprehensive Media Coverage: Quantify the impact of all channels, including social media, influencers, search, and emerging platforms, ensuring no opportunity is missed and every dollar drives maximum impact.
Media Elasticity Insights: Measure channel-specific elasticity to pinpoint the "sweet spot" where additional spending yields the highest returns before saturation, plus the economic optimum for balancing efficiency and scale. For analytics-savvy marketers, this means statistically robust insights accounting for saturation and cross-effects, enabling data-driven budget reallocations to maximize overall marketing mix performance.
Pricing & Promotions Mastery: Understand how pricing strategies and promotions influence sales, empowering you to optimize tactics that boost margins and loyalty without guesswork.
Brand & Experience Impact: Gain clarity on how brand perception and customer experiences drive loyalty and revenue, fostering long-term advocacy that fuels sustainable growth.
Macroeconomic Intelligence: Track external factors like CPI fluctuations and housing starts to anticipate demand shifts, enabling proactive strategies that protect your bottom line.
Turn Guesswork into Precision Strategy: Armed with these insights, you can confidently shift budgets to amplify ROI, transforming your marketing into a high-performance engine.
How Omnichannel Attribution & Optimization: A Simple Breakdown
Curious about the process? Our marketing mix modeling approach is straightforward yet powerful:
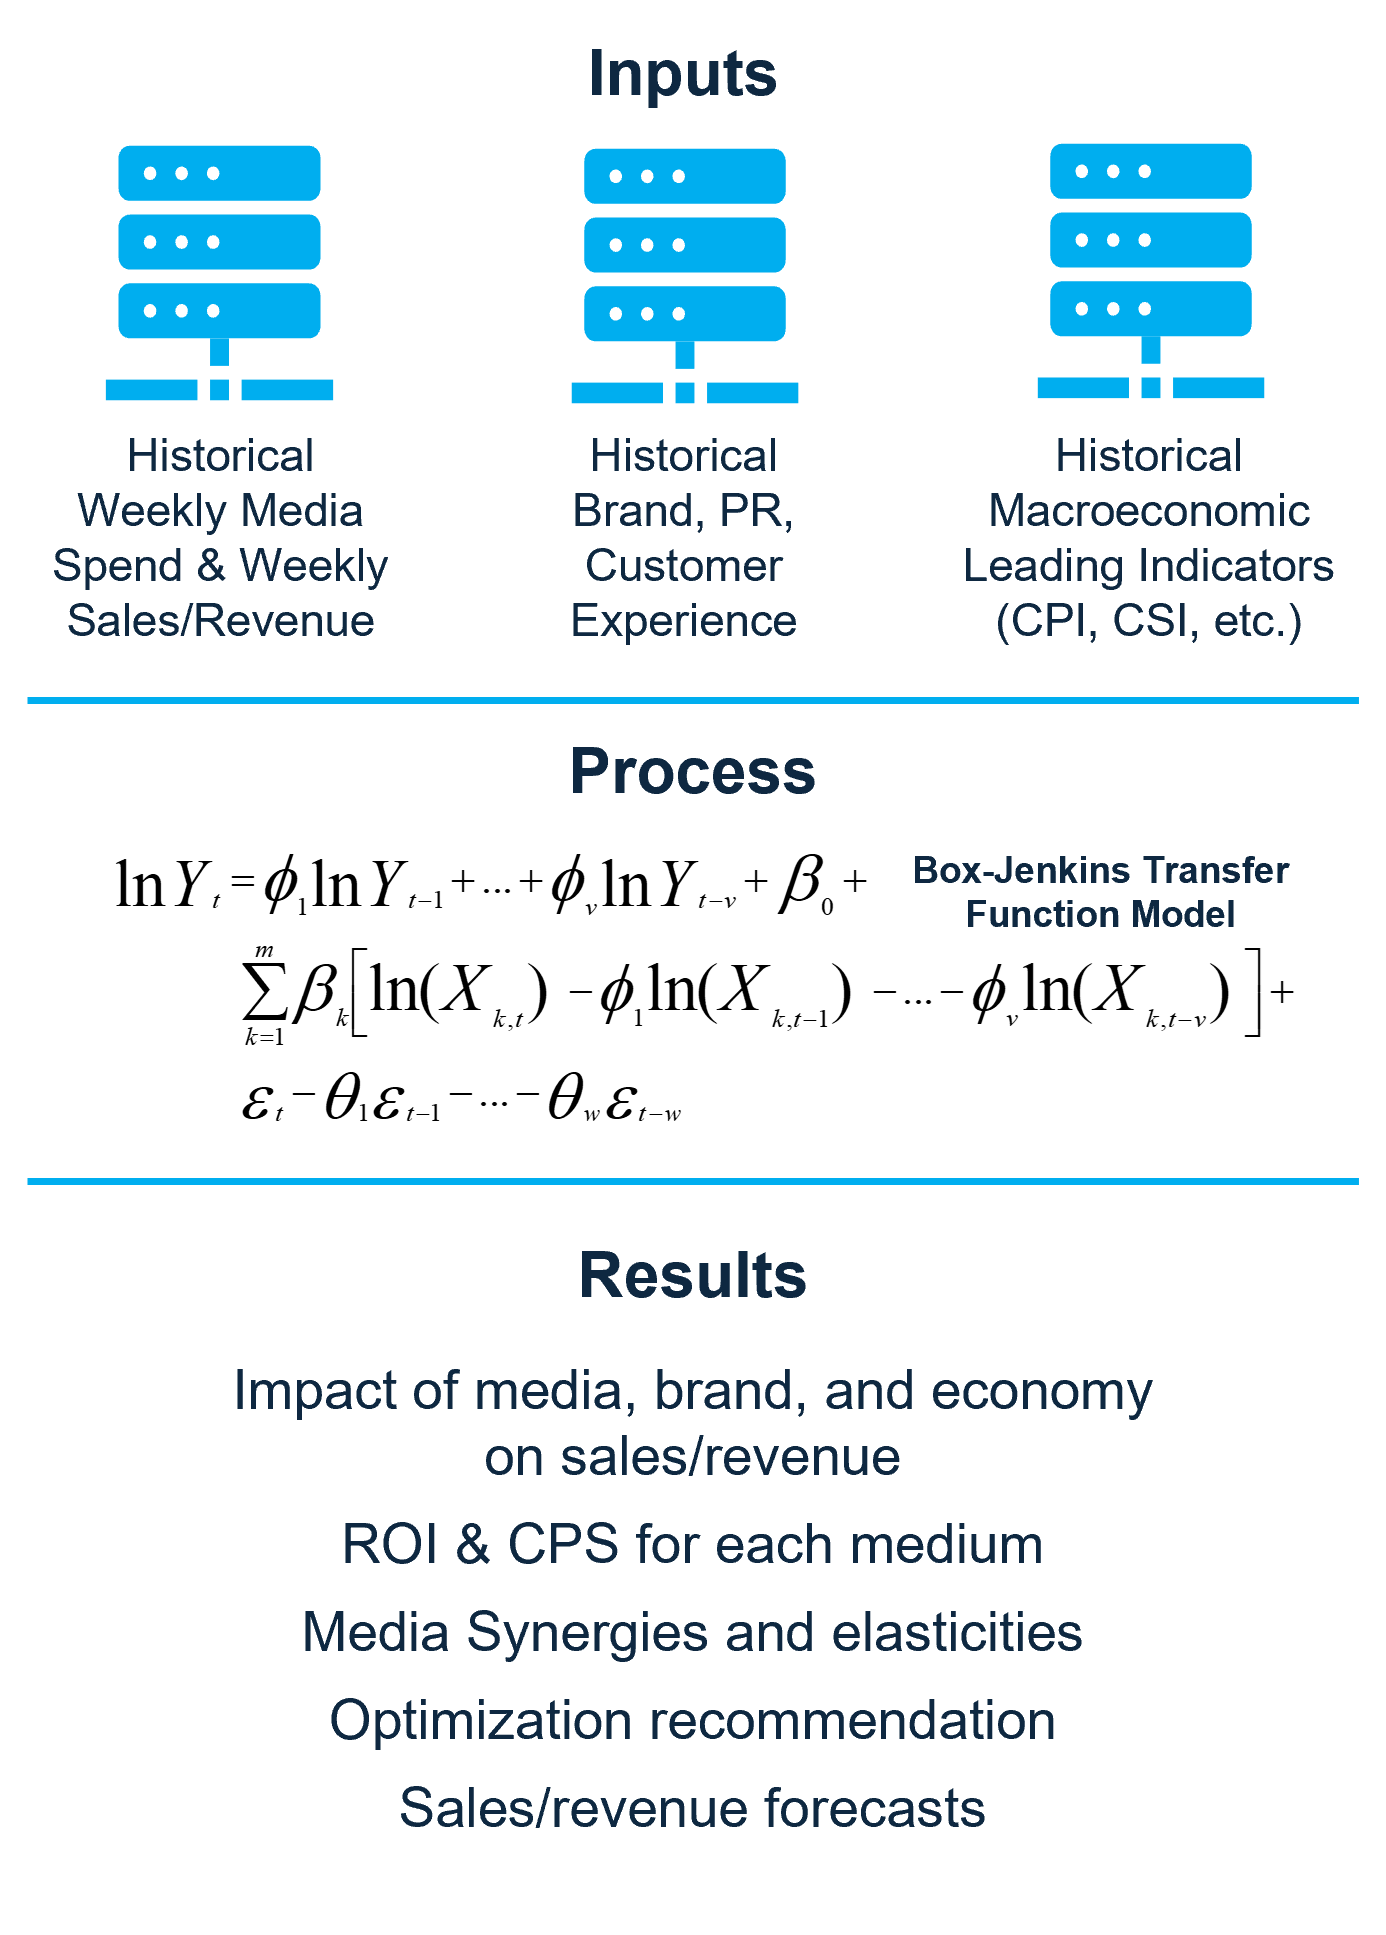
Data Collection: We start with your weekly sales/revenue and weekly media spend, no guesswork, just facts.
Model Building: Using econometric techniques, we create custom models that factor in variables like pricing, promotions, and customer experience, in addition to your media.
Analysis & Insights: Dive into ROI, elasticity, and optimal spends for each channel in your marketing mix.
Actionable Recommendations: Get clear strategies to reallocate budgets and maximize your performance.
Iterative Optimization: Refine models over time as your business evolves, keeping your actionable insights cutting-edge.
Why Choose Polaris Research for Omnichannel Attribution & Optimization?
Our solution takes marketing mix modeling to the next level to deliver transformative results. Here's what sets us apart:
Tailored Econometric Models: Built specifically for your business, using your historical business data and leading macroeconomic indicators to ensure accuracy in omnichannel analysis.
Channel-Specific ROI Insights: Uncover which media channels deliver the best bang for your buck, optimizing your marketing mix for superior performance.
Elasticity and Optimization: Identify ideal spend levels to avoid waste and hit peak efficiency.
Data-Driven Decisions: Move from intuition to evidence, reallocating budgets with confidence to boost overall ROI in your marketing efforts.
Comprehensive Support: From setup to ongoing refinements, we guide you through every step of implementing marketing mix models.
Real Results from Omnichannel Attribution & Optimization
Imagine increasing your ROI by 10-30% through smarter spend allocation. That's the power of Polaris Research's omnichannel attribution and optimization models. Our clients report:
Reduced wasteful spending on underperforming channels.
Amplified growth from high-elasticity media.
Better forecasting for future campaigns in a dynamic marketing landscape.
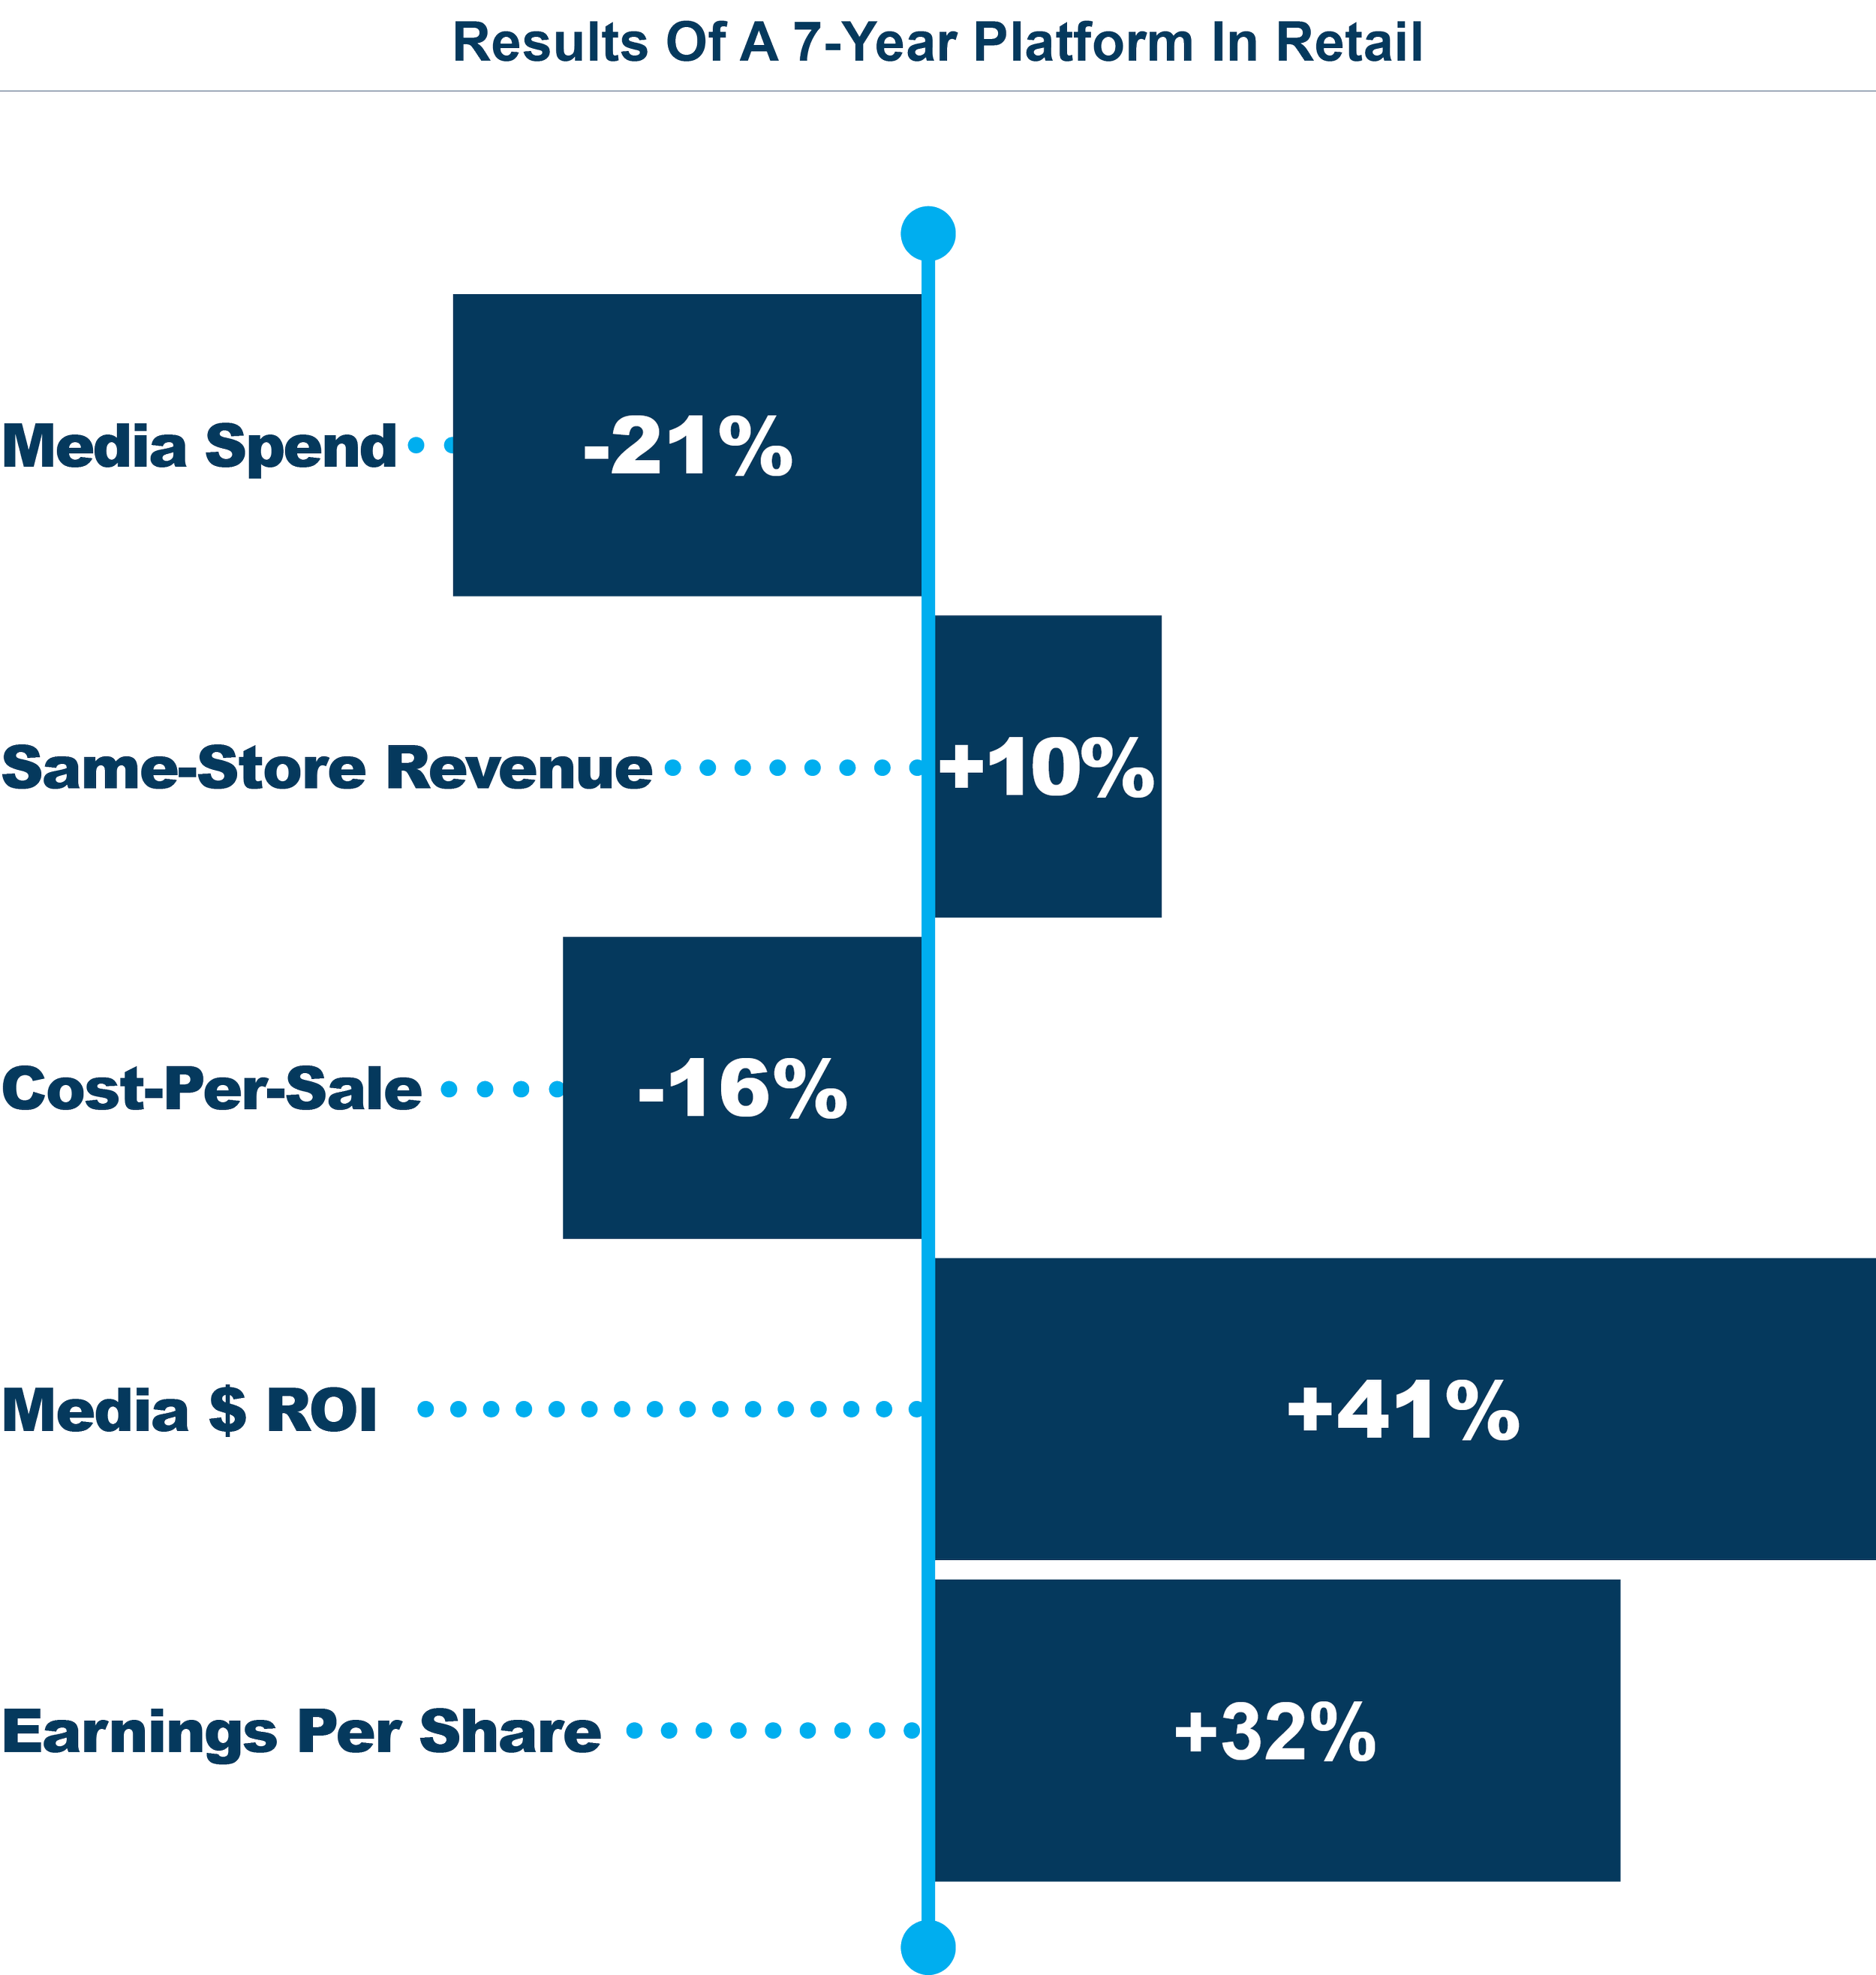
QSR Case Study
Our analysis and resulting media
adjustments resulted in:
11% increase in media-stimulated transactions
16% increase in all-media ROI
$31 Million increase in annual net revenue
Ready to Elevate Your Business?
Don't let outdated strategies hold you back. Contact Polaris Research today for a free consultation on the next level of marketing mix modeling and start optimizing your business for real, measurable success. Let's turn your data into dollars!
Email: info@marketingmixmanager.net
Phone: 888.403.6008