

Omnichannel Attribution & Optimization
Quantify sales contributions for each medium.
Calculate ROI for each medium.
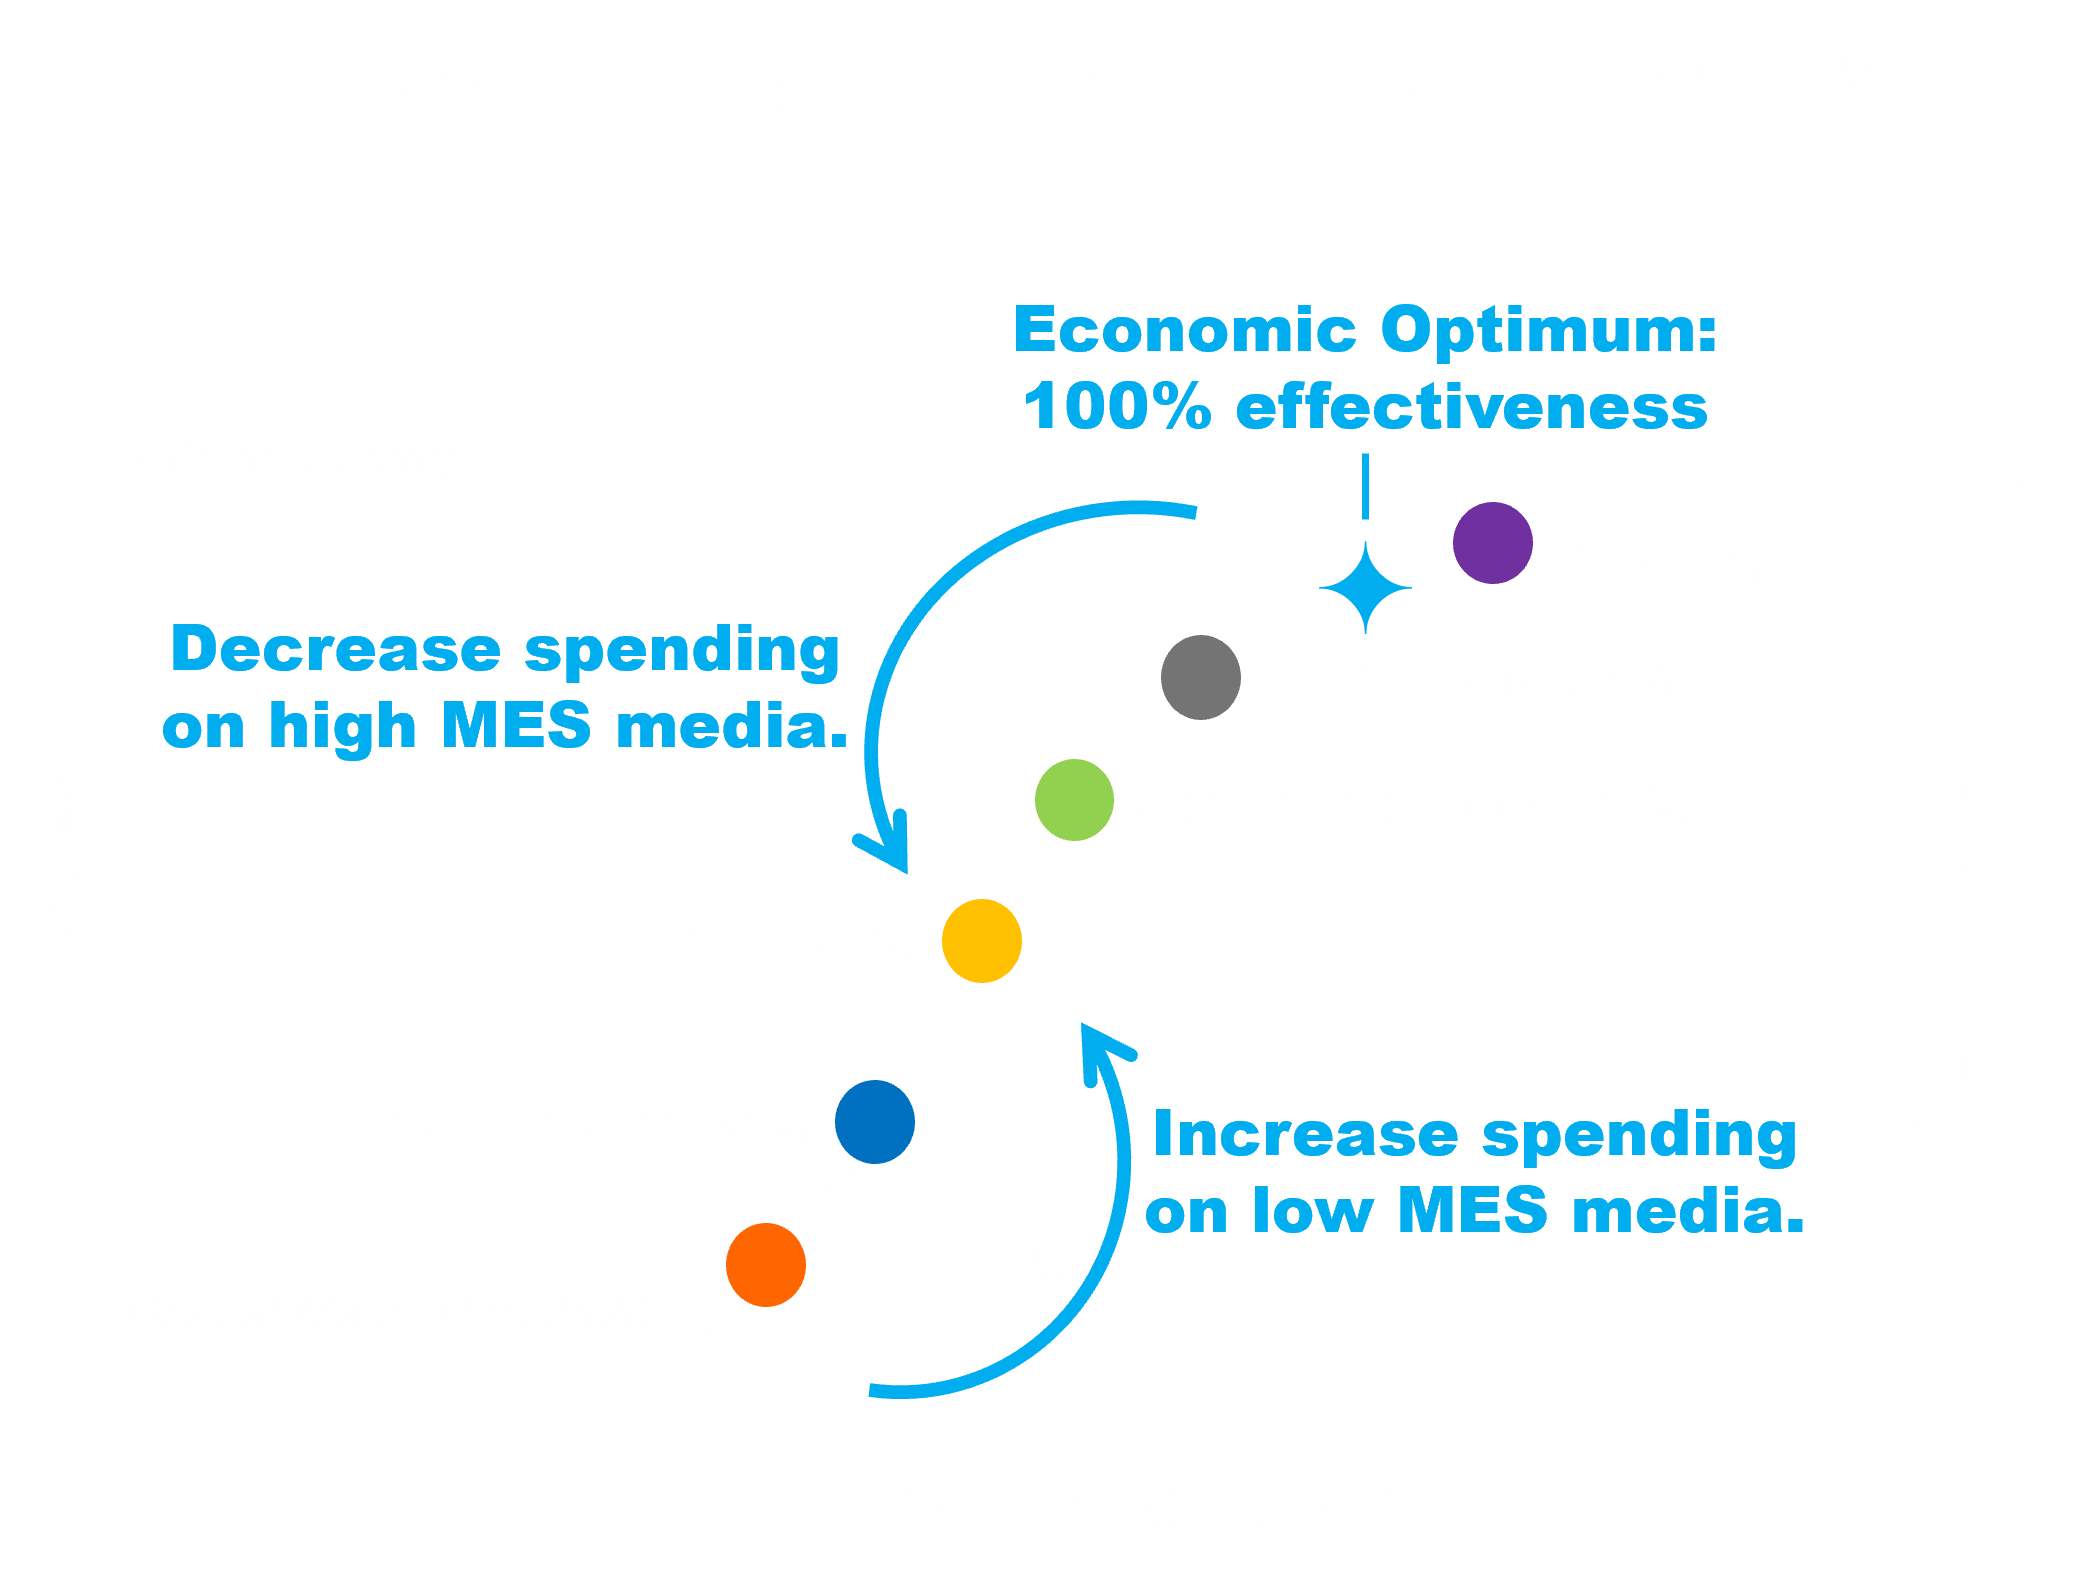
Understand elasticity to increase ROI.
Plan, forecast & track progress to goals.
Capitalize On AI-Infused Econometrics
Our Solution

Quantify, Optimize, and
Forecast Media &
Advertising Performance
Quantify contribution of media and advertising to brand, store traffic, and revenue.
Optimize media and creative to maximize ROI and minimize CPS.
Generate accurate traffic/revenue forecasts and set year-end financial targets.

Analyze the impact of brand
and customer experience on
sales and revenue.
Brand awareness (surveys, social mentions), sentiment (NPS, social media sentiment analysis), or engagement (website visits, social interactions).
Customer Experience Metrics: Customer satisfaction (CSAT), Net Promoter Score (NPS), customer retention rate, or average resolution time.

Quantify the impact of
macroeconomic factors (CPI, Inflation, Weekly Wages, etc.)
Know which macroeconomic leading indicators (MLIs) are critical to your bottom line.
Understand how long it takes for changes in the MLIs to impact your business.
Time your media planning to leverage upturns & mitigate downturns.
“We improved our sales 15% after just the first quarter of operation and the rolling forecast was accurate to less than 1% error a year out, allowing rapid response to competitors and other external market events.”
Telecommunications & Entertainment Client

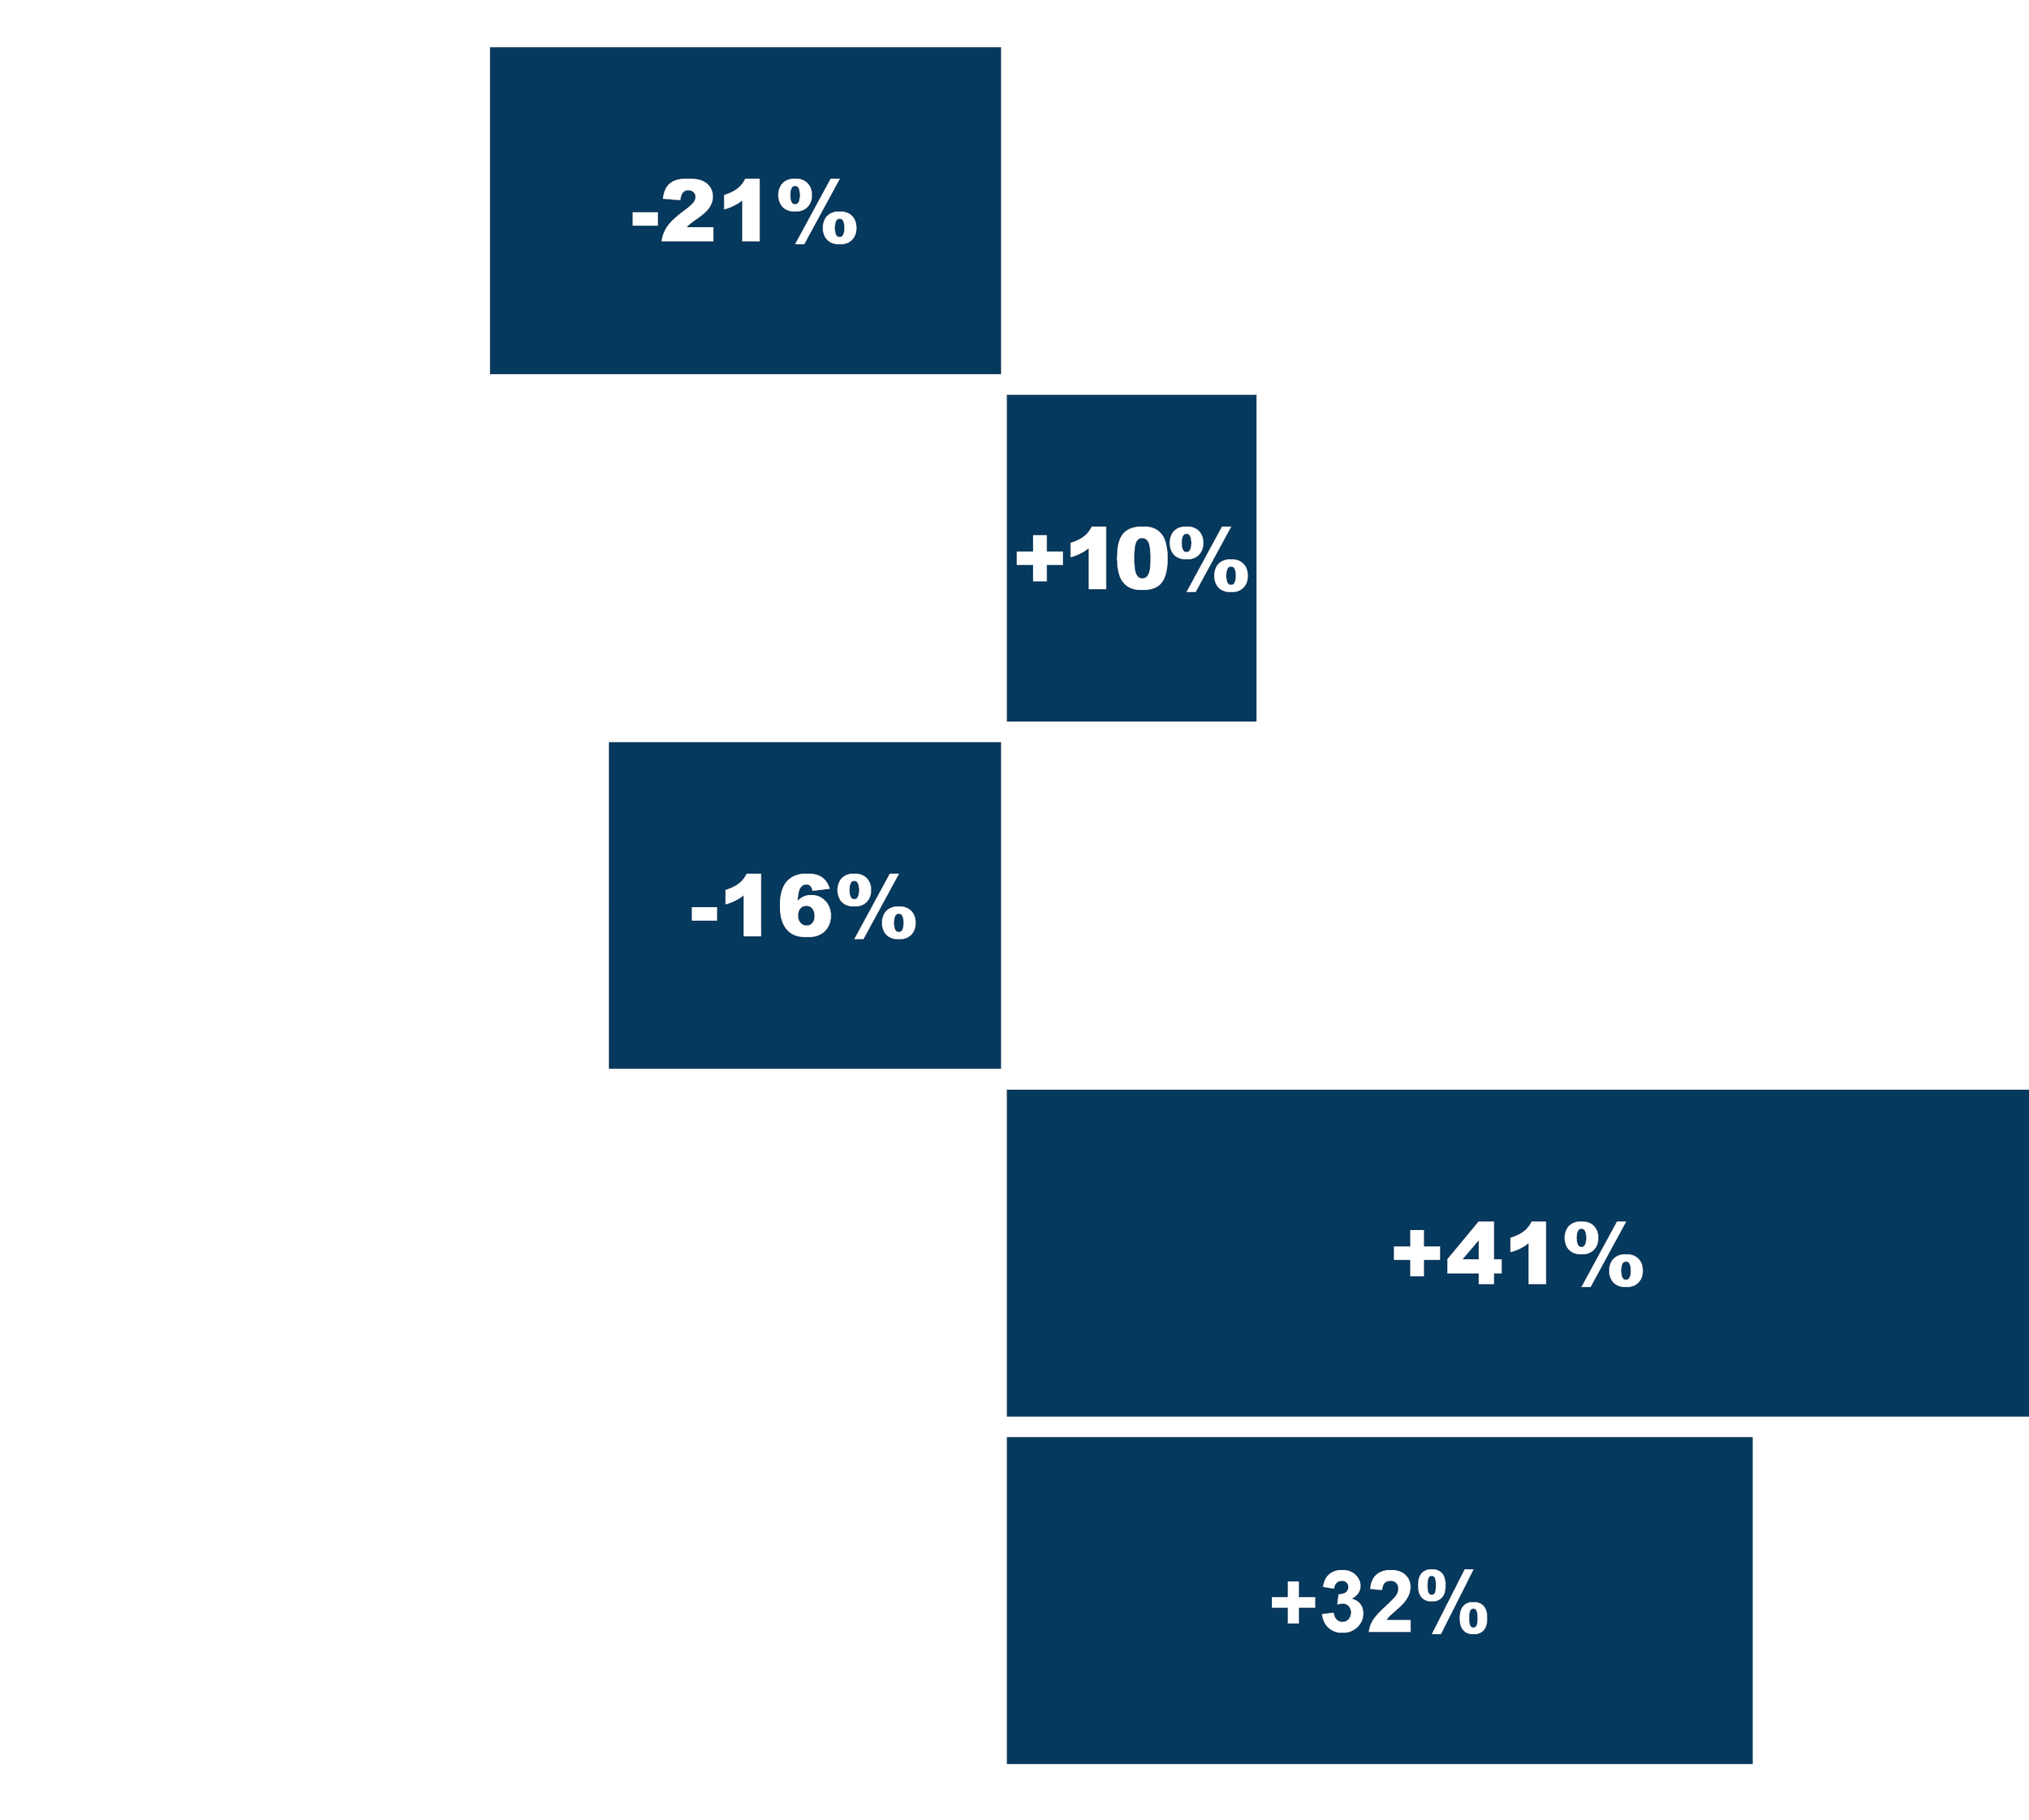
Retail Case Study
Over the course of 7 years, through the COVID-19 pandemic and thereafter, ongoing continuous improvement efforts have generated significant gains for our client in both store and web sales.
At Polaris Research, we’ve been perfecting this craft for over 20 years. Our solution, built on the reliable Box-Jenkins AI-Infused Transfer Function time-series modeling approach, goes beyond basic analytics. We weave in real-world factors like your brand’s strength, customer service performance, and economic trends, while diving deep into granular details like specific media markets (DMAs) or individual stores. We also track how marketing effects media build up or decay over time, delivering tailored recommendations that have driven revenue growth for major advertisers, as shown in our industry solutions and case studies.


How We Do It
Omnichannel Attribution & Optimization
Polaris Research delivers a powerful Omnichannel Attribution & Optimization solution that drives exceptional results for large advertisers. Our integrated approach models media, pricing, promotions, creative, customer experience, and external factors to optimize sales and revenue.
Key Benefits:
Maximized ROI: Continuous improvement cycles enhance media impact at both portfolio and campaign levels, ensuring efficient budget allocation and increased sales.
Holistic Insights: Comprehensive views across customers, products, channels, and markets empower data-driven decisions.
Precision Optimization: Macro-level budget adjustments and micro-level campaign enhancements work in tandem to boost performance.
Accurate Attribution: Advanced structural equation modeling overcomes last-touch attribution flaws, properly crediting awareness-building media for driving search and sales.
Flexible & Scalable: Tailored to any industry, our solution incorporates traditional and custom metrics, from brand loyalty to employee surveys, for a complete performance picture.
With Polaris, large advertisers achieve smarter media investments, stronger customer engagement, and sustained growth through our proven, iterative optimization system.
>> Quantify media elasticity / impact.
>> Decompose sales by medium / tactic.
>> Calculate ROI & CPS.
>> Optimize your marketing mix.
>> Forecast sales, revenue, etc.
Marketing Mix Manager®
Your Performance Marketing Portal
Marketing Mix Manager® DEMO
Clients
Companies:


Agencies:
Contact Us
Email: info@marketingmixmanager.net
Phone: 888.403.6008
We deliver tailored, data-driven solutions with transparency and agility to drive your success.
Contact Us
No Cost Consulting
Proposal
“I love working with Dr. Ralston and his team. They understand our business and have a had huge impact on our performance.”
Hotel Client
We respect your privacy and will not sell or share your data.